Zone Heatmaps · 13 zones
Where guests gather most
Per-zone crowd density heatmaps powered by 28 cameras and computer vision · click any zone to inspect its hotspots, dwell, conversion and demographics.
Zones · pick to inspect
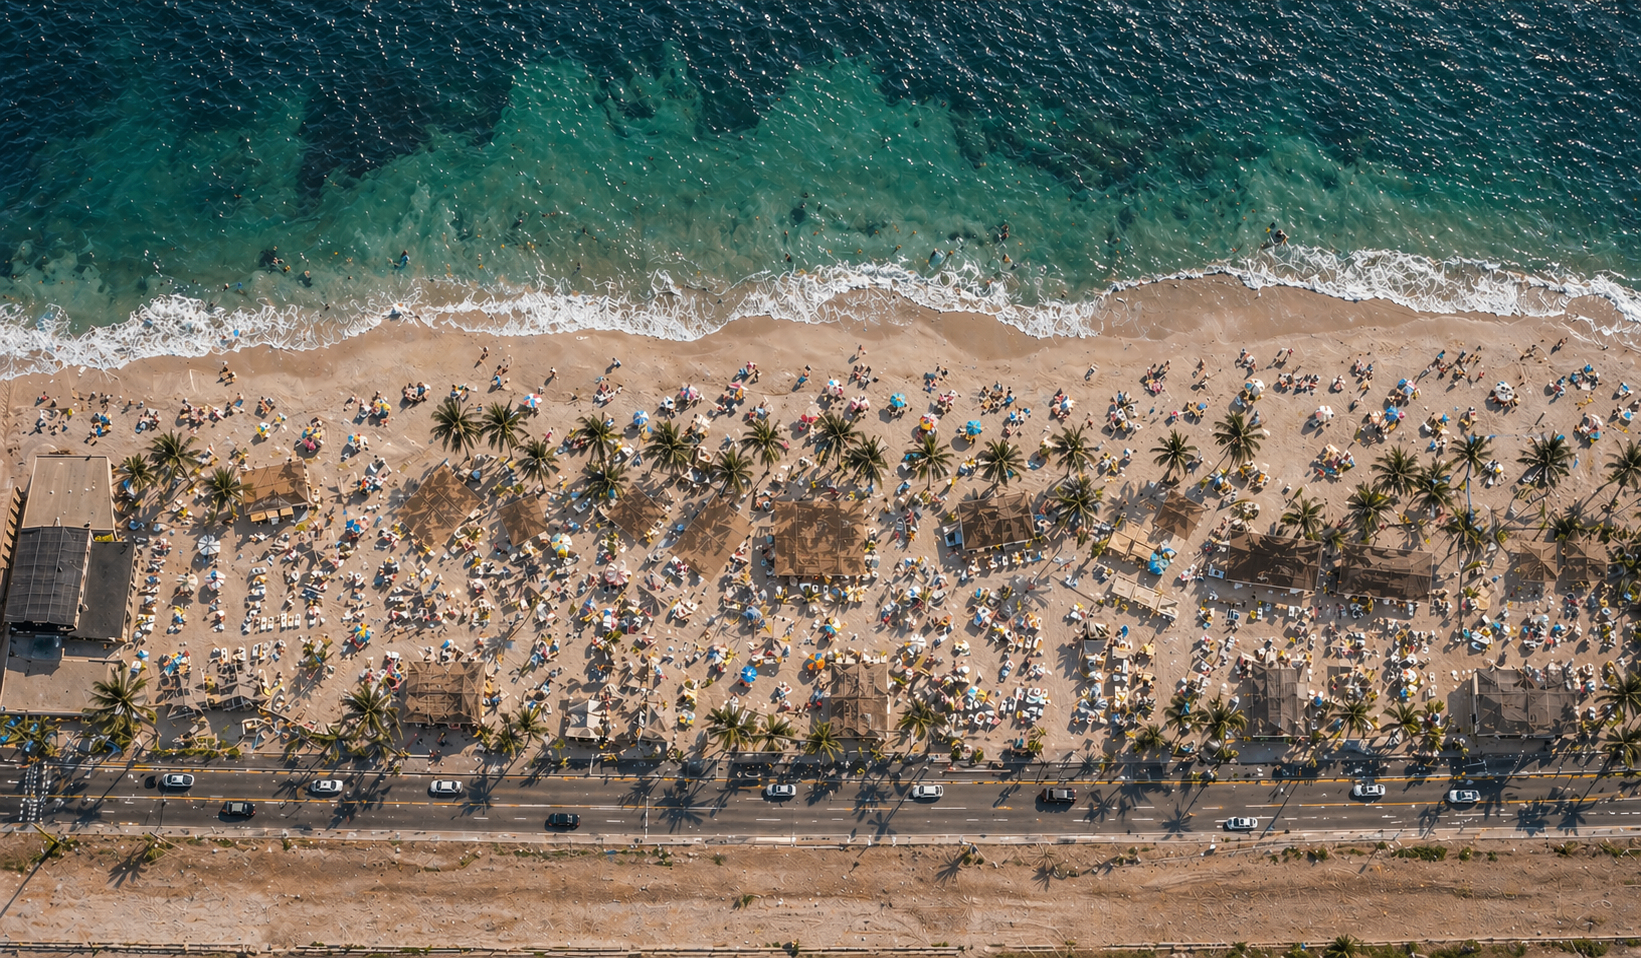
Beach · Live heatmap
Jaydana Lounges
Capacity 280 · Density 1.4 p/m² · 6 staff present
94%
OCCUPANCY
LIVE
28cams
138ms
N
Total guests
263
Peak zone
Sec C95%
Ingress / h
1,168
Egress / h
911
Conv avg
65%
Map signals · live · 5 hotspots tracked
refreshed every 1.2s
Hotspots
5
2 critical
Peak intensity
95%
Sec C
Crowd density
1.4 p/m²
Medium
Flow / hour
292
ingress
Capacity used
94%
263 / 280
Avg Dwell
5h 18m
Conversion
71%
Revenue / day
AED 84.2k
Sentiment
8.6 / 10
⏱️ Flow
Behavioral Metrics
Average dwell5h 18m
Flow velocity0.82 m/s
Abandonment rate3.8%
Queue length (P90)8 pax
Wait time (avg)112s
💰 Yield
Commercial Metrics
Conversion rate71%
Estimated revenue / hourAED 10525
Revenue per m²AED 301
Avg transaction valueAED 109
👥 Audience
Demographics (aggregate)
Solo / Couple / Family / Group14% · 32% · 41% · 13%
Age 0–12 / 13–34 / 35–50 / 50+18% · 38% · 31% · 13%
Returning visitor42% (this week)